Google Analytics lets you segment and filter data in hundreds of different ways. When you think about what GA does and how much granular data it logs, it’s downright astonishing. It’s even more astonishing that this data is readily available and can be viewed within the Google Analytics interface without needing to request custom reports.
However, there is a limit to how much data can be processed. When you pull a large date range, or look at a busy month and try to segment by landing page, device, location, etc – you’re requesting Google Analytics to process hundreds of thousands of data points. When you consider that Google Analytics is deployed (for free) across millions of websites, it’s easy to see how the amount of processing power required could quickly spiral out of control.
So what happens?
Instead of saying “report unavailable” or “too much data to process,” Google Analytics uses data sampling. It takes looks at a much smaller cross-section of the data and assumes it is an accurate sample of the entire dataset.
Picture this: you want to know how much sleep you get in a year. Instead of tracking how much sleep you get every night for 365 days, you log how many hours you sleep in one week and multiply that by 52 weeks. The assumption is that the one week you track is a pretty typical week, representative of the way you sleep most of the time.
What’s the problem?
That one week may not be representative of the way you sleep all year. Maybe you sleep more in the winter and less in the summer. Maybe your work schedule varies and that affects how much you sleep on a week-by-week basis.
Sure, you could take a larger sample size – track 4 weeks and then multiple by 13 instead of 52. The larger the sample size, the more likely it is to be accurate. But it’s still not perfect because you’re making assumptions that those other 48 weeks follow the same pattern as the four you’re measuring.
How Does Data Sampling Apply to Google Analytics and SEO?
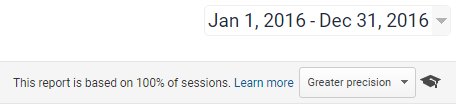
Tracking how much you sleep probably isn’t that critical, but when you’re making marketing decisions that cost tens or hundreds of thousands of dollars, you want to be sure you’re using accurate data. You can avoid data sampling, if you’re mindful of it and recognize when it’s happening. Google Analytics does let you know when the report you’re looking at is based on sampled data, but it’s very non-descript, located in the top right corner with nothing to draw your attention to it.
“This report is based on 100% of sessions” indicates the data is not sampled.
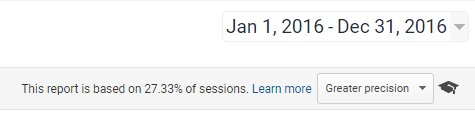
Anything lower than 100% is the percent of visits that the report is based on. The lower the number, the smaller sample size.
How Much Does Data Sampling Skew The Numbers?
Let’s look at some test cases. In both of them I used an Organic-only Google Analytics View, with a mobile traffic segment applied and a date range of 1 year (1/1/16 to 12/31/16). This is a very common setup, that allows you to report on metrics relevant to mobile device performance over a 1 year period.
In the two test cases below, the dataset was pulled in two ways:
- Monthly numbers were pulled in 1 data export for a 12 month date range.
- Monthly numbers were pulled in 12 data exports for 1 month date ranges.
Data Sampling Test Case #1: Sessions
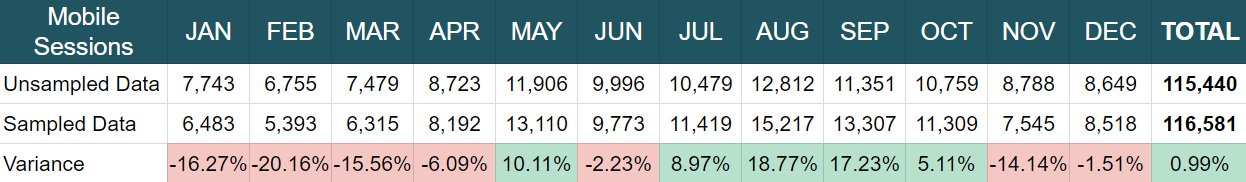
In this report we’re just looking at sessions (visits) for a high level overview. This is a very straightforward report – finding out how many visitors came to the site on mobile devices and trying to establish a month-by-month trend.
The unsampled default report shows a total of 338,827 visits during this time period. After adding the mobile segment, the sampling rate was listed as 27.33% – meaning the sample size was only 27.33% of the total visits.
The graphs below show the variance between the single data pull and the 12 data pulls. In this example, the sampled data is over-reporting by 0.99%.
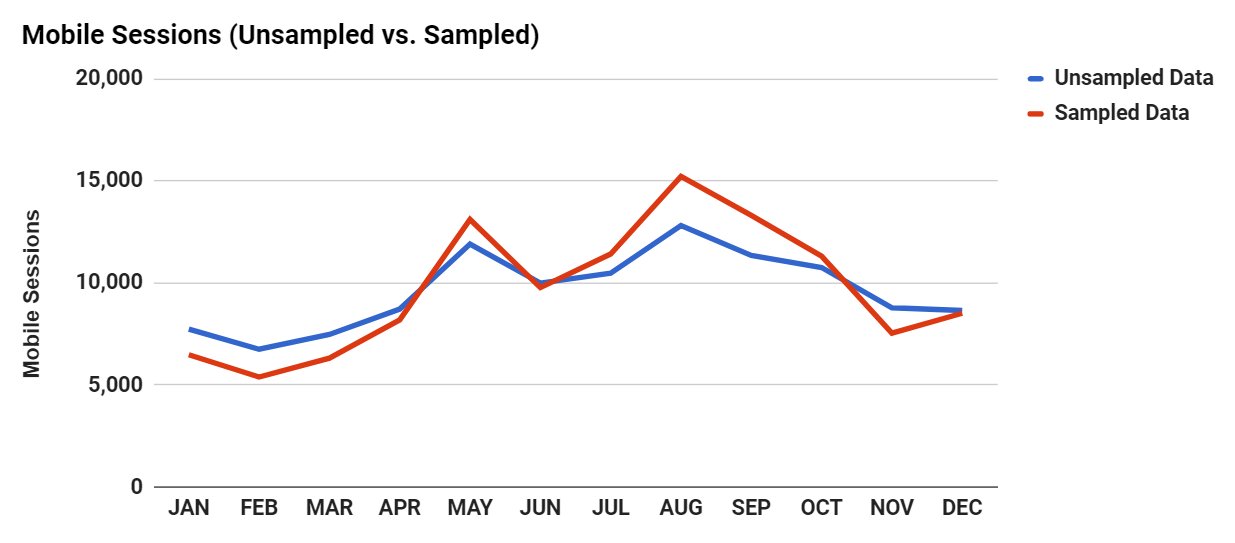
That may seem minor, but look at the individual months – the variation is much wider on a monthly-to-month basis – anywhere from -20.16% to +18.77%. More than half of the 12 months in the year were off by more than 10%.
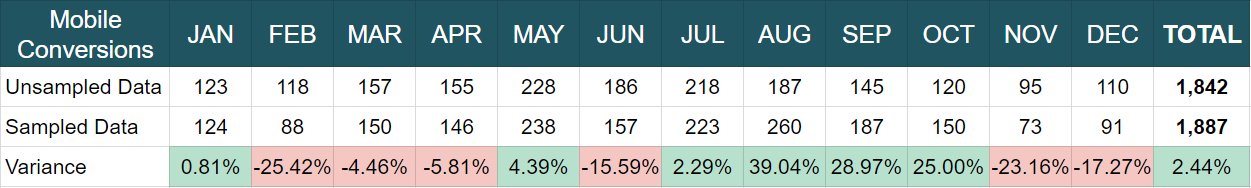
Data Sampling Test Case #2: Goal Conversions
In this report we’re drilling down into goal conversions which are more important in many cases – these might represent actual customers or leads.
The unsampled default report shows a total of 6,341 goal conversions during this time period and the sampling rate is still 27.33% because we haven’t changed the segment we’re using. In this case, the overall numbers are only slightly worse – over-reporting by 2.44% instead of 0.99%.
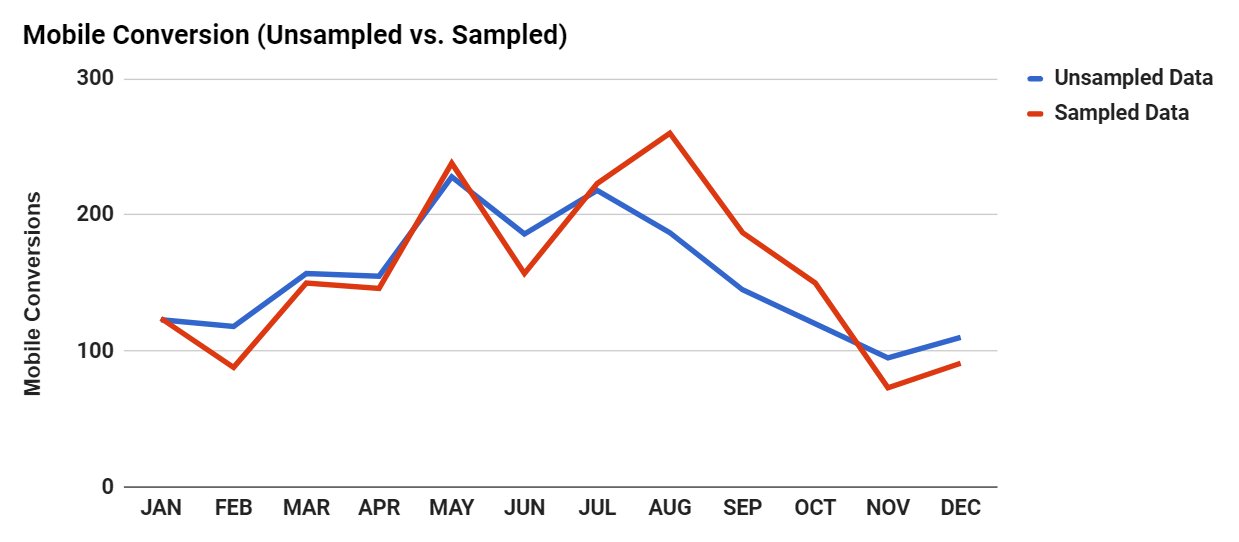
However, the monthly variance is MUCH worse. Look at August: over-reporting by a whopping 39.04%! September and October aren’t much better, over-reporting by 28.97% and 25% respectively.
Both of these reports are completely inaccurate and worthless for establishing seasonal patterns, or year-over-year performance by month. The only way to get accurate data is to use unsampled data, either with smaller date ranges, or using the API.
When Does Sampling Occur?
Data sampling does not occur in default reports, but adding segments or filters will trigger sampling. It doesn’t necessarily matter what segments or filters are added – they could be based on landing pages, devices, mobile vs. desktop, etc. It also depends on how many sessions are within the date range. A site that gets 500,000 visits per month will encounter data sampling much sooner than a site that gets 50,000 hits a month.
How To Avoid Data Sampling in Google Analytics
For one, use a smaller data range. Smaller date ranges reduce the number of visits, which reduces the likelihood of sampling. If you’re trying to look at a larger date range, exporting data in smaller batches is the way to go. This can be tedious if you’re trying to use the Google Analytics interface, which is why I recommend using the Google Analytics/Sheets API. The Google Analytics/Sheets API is incredibly easy to use and does actually reduce the sampling rate itself. It’s also much faster for exporting multiple datasets at once.
You can also set up Google Analytics Views specific to certain data sets. Views exclude data before it even gets into the interface. The session limit is still the same, but when you add filters/segments, you’re doing so with a smaller amount of data points, so sampling doesn’t occur as quickly. I always set up an Organic-specific View so that I can look at organic data by itself – that helps avoid the session limit when segmenting landing pages by URL structure, for example.
The last choice is to upgrade to Analytics 360. This is Google’s premium version of Standard Analytics, and lifts the sampling threshold from 500,000 sessions (at the property level) to 100 million sessions. It’s worth noting that Analytics 360 costs well over $100,000 – far outside the reach of many companies who aren’t big enough to afford it, but do get enough traffic for data sampling to be a common occurrence.
Summary
- Sampled data is not accurate data.
- Never use sampled data for reporting or analysis.
- Sampled data can be eliminated by choosing smaller date ranges, the Google Analytics/Sheets API.
As always, tweet me @BerkleyBikes or comment here with questions.
