
Listen, I get it. You’re not a developer and neither am I. The letters A-P-I probably give you palpitations. BUT, if you’re using the Google Sheets add-on, the Google Analytics API is really simple. Seriously.
What follows here is a beginner’s introduction that shows how to start using the API. This is for non-technical types and will start at square one. Full documentation is available at Google’s Implementation Guide.
Step 1: Getting Google Sheets Set Up
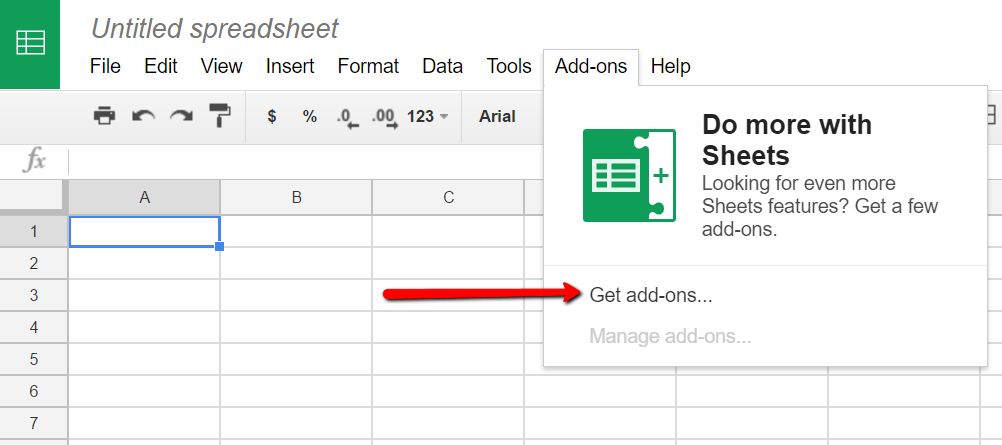
First, log into a Google account that has access to the Google Analytics account you normally use. Go to Drive and open a new Google Sheet, then go to the menu bar and select Add-ons > Get add-ons.
Next, search for Google Analytics and you’ll find this add-on:
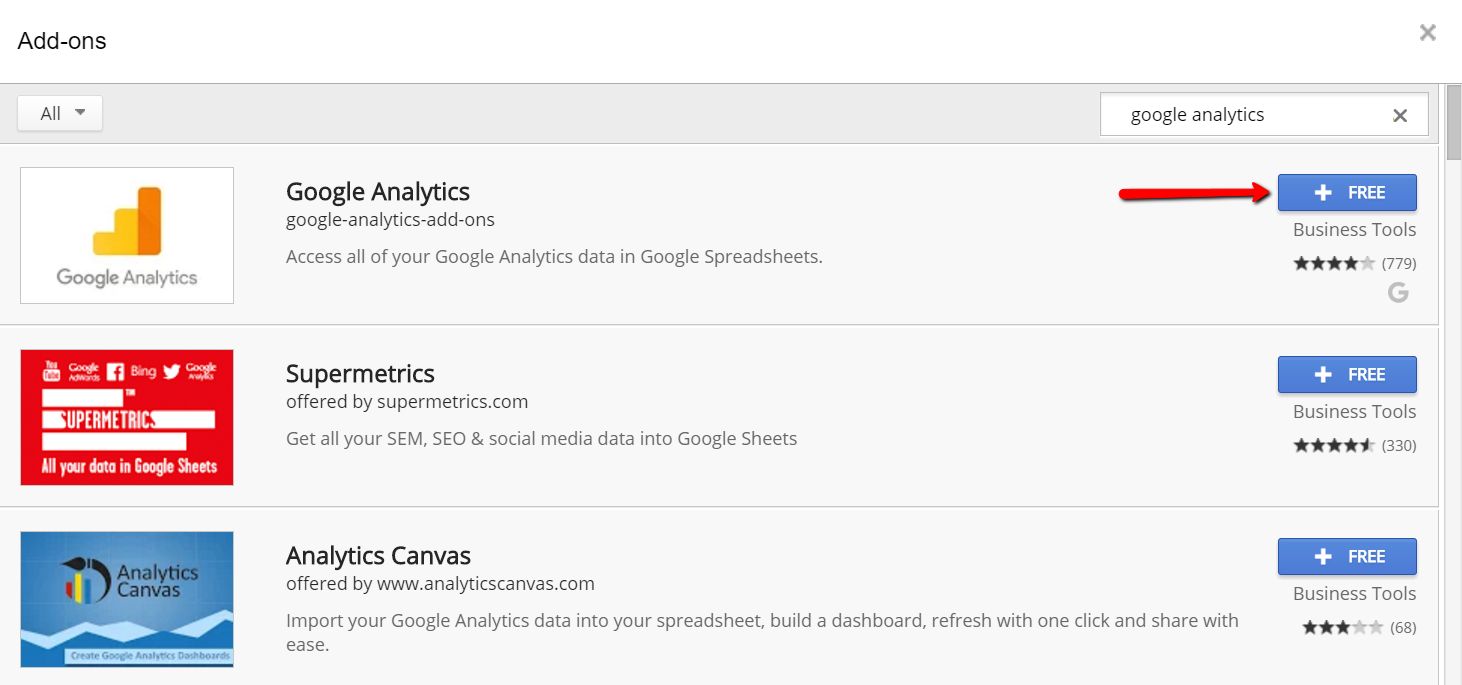
Go ahead and click the +Free button to add it to your Google Sheet. When the authorization prompt pops up, click Allow at the bottom right.
Step 2: Getting Your Report Configuration Set Up
When you create a report the first time, the add-on does offer a user-friendly interface with drop down menus, etc, to help you set up your first report. You can access this by going to Add-Ons > Google Analytics > Create new report. I’m not going to use that, because ultimately, you’ll be making changes in the Sheet itself and it’s more valuable to understand what each of these fields does.
Now that you’ve got the add-on installed, go to Add-Ons > Google Analytics > Run reports. You’ll see this pop-up indicating the report failed, which is expected – we haven’t configured anything yet.
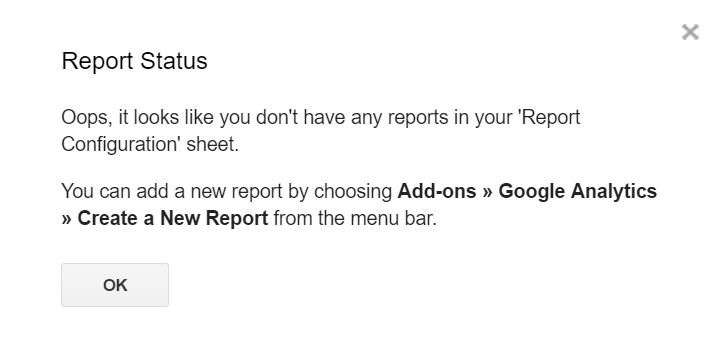
The point of doing this is: the add-on has now populated all the configuration fields that we’ll be working with to get it set up properly.

All those fields probably look confusing, but we’ll start breaking them down one by one and you’ll see it’s not that complex to pull basic data.
Step 3: Configuring Individual Fields
Report Name
When you run the report, the add-on is going to create a new tab in your Google Sheet with the information you’ve selected. Report Name simply tells the add-on what to name that tab. You can call it whatever you want, I’m calling it JAN.
Important Note: When you re-run the report multiple times, it will replace the data in the tab you’ve created. If you change the Report Name, it will create a new tab, preserving the old one. If you run the report and then delete the Report Name, it will keep the existing tab and preserve the data without creating another tab.
Type
Enter core.
core
View (Profile) ID / ids
Go into the Google Analytics view you want to pull data from. Click over to Admin and select View Settings under View.
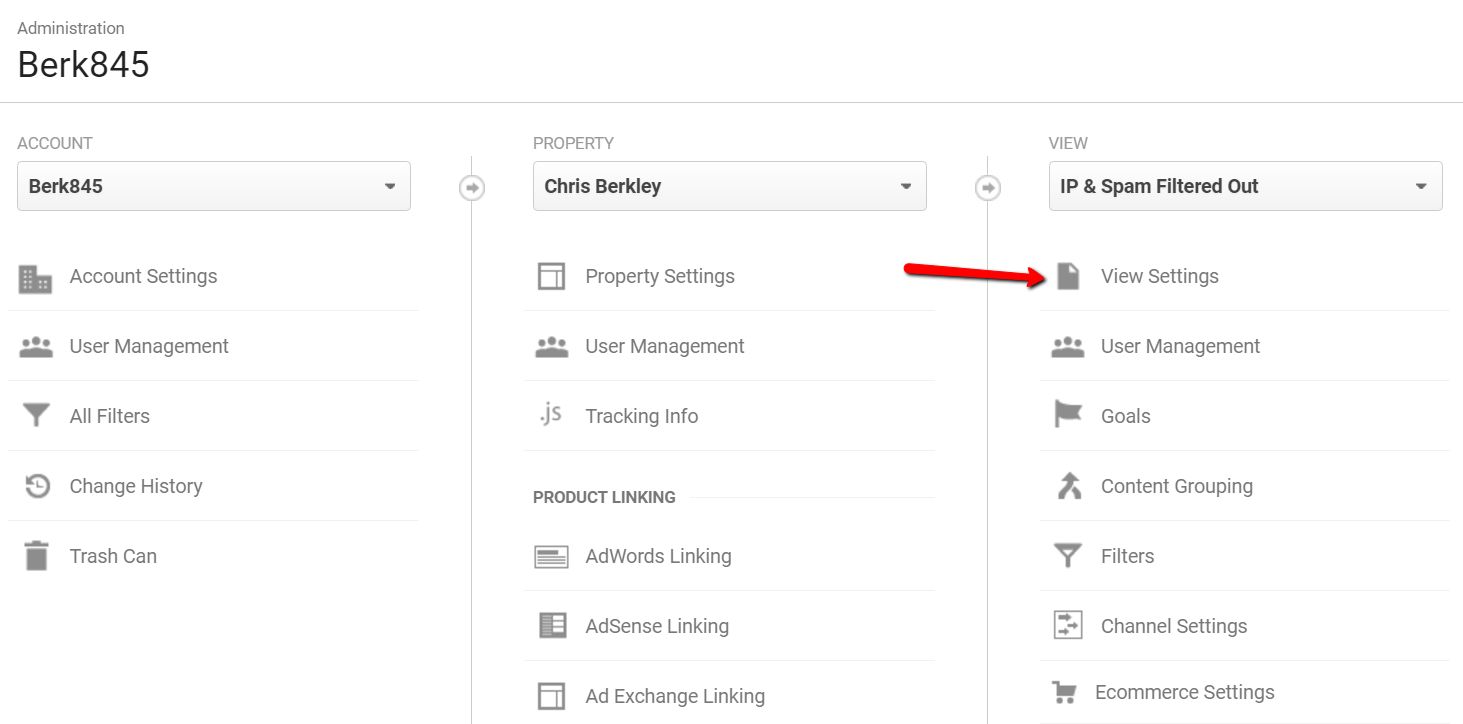
Copy the View ID number.
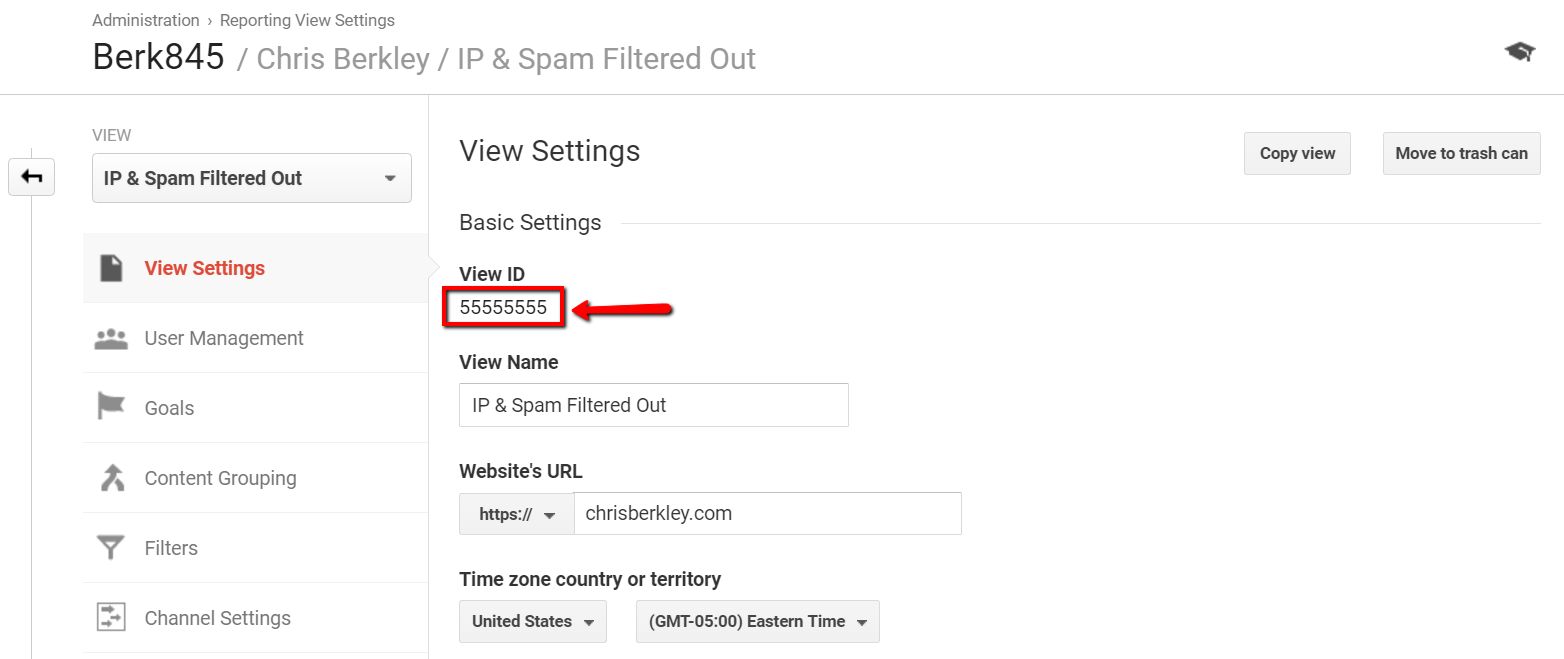
Paste this into the Google Sheet with ga: in front of it.
ga:55555555
Start Date
This is no different than setting the data range in Google Analytics. Add the start date in a normal date format.
1/1/17
End Date
Same as the start date, just pick your end date. Make sure it’s a date in the past, and a day with complete data. For example, if it’s March 5th, don’t pick a date range of 3/1/17 – 3/31/17. Also, don’t pick a date range of 3/1/17 – 3/5/17 because that day isn’t over yet and you’ll have incomplete, sampled data (Learn more about data sampling).
Last N Days
You can also pick a fixed number of days prior to the current day. I don’t use this field, but if you did, you’d simply enter an integer for the number of days you wanted to report on. For clarity, I suggest removing the start/end date, but the add-on does appear to override those dates if the Last N Days field is populated.
Metrics
This is the important stuff you really want to measure and you can have multiple metrics in here. You can use the Dimensions & Metrics Explorer to find Metrics to use. Since this is a basic guide, we’ll stick to simple ones.
- ga:sessions – Pulls the number of sessions.
- ga:goal1Completions – Pulls the number of Goal 1 Completions.
- ga:goal2Completions – Pulls the number of Goal 2 Completions.
These will all get entered into the same cell.
ga:sessions
ga:goal1Completions
ga:goal2Completions
Dimensions
Using the GA interface, you have the option to define the primary dimension, and you can do that here too. Popular choices might be:
- ga:landingPagePath – Find landing pages responsible for sessions and goal completions.
- ga:medium – Find the number of sessions and goal completions by channel (Organic vs. Referral vs. Paid, etc.)
- ga:sourceMedium – Find sessions and goal completions by source & medium (Google Organic vs. Bing Organic vs. Google CPC, etc.)
We’ll keep it simple and go with landing pages. If you want to measure those by a specific medium, we’ll add that in a few paragraphs below this.
ga:landingPagePath
Sort
Really simple. How do you want the data sorted? Obviously, you can only sort by one dimension, so pick the dimension of your choice from above and enter it in this cell. GA’s default is to sort by sessions from high to low, and if you want to do that, enter a minus sign before the metric.
-ga:sessions
Filters
You can start to get really complex here, and if you use filters when you normally look at data in GA, you’ll need to add those here. For now, we’ll use a basic filter to look at organic traffic only.
ga:medium==organic
This ensures we’re only pulling sessions, goal completions and landing pages from the organic medium.
Segment
Segments are arguably the most complex field of this report. There are multiple ways you can create segments, and the criteria for building them can be found in Google’s core reporting documentation.
In short, they can follow a syntax similar to this, where you’d have a segment for sessions from Canada:
sessions::condition::ga:country==Canada
For simplicity, I won’t use a segment in this walk-through.
Sampling Level
I never pull sampled data because it doesn’t paint the whole picture. Because of that, I opt for the higher precision setting and I suggest you do too.
HIGHER_PRECISION
Start Index
This option allows you to only show results from a specific starting point. For example, if you were pulling landing pages and wanted to ignore the top traffic-driving page (like the homepage) you can set this to ‘2’ and it will ignore that top result. I don’t use this much.
Max Results
The maximum value is 10,000, so no real reason to set it lower than that.
Spreadsheet URL
If you want to export the results into a separate sheet, you can enter the URL here.
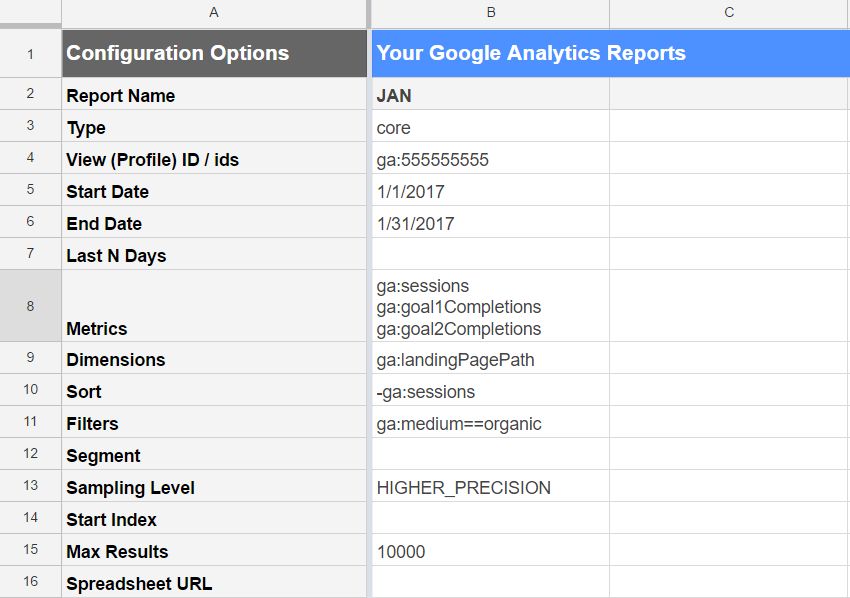
Final Review
Once you’ve filled out all the fields, your configuration will look something like this:
Step 4: Run the Report
Once you’ve filled out all the fields, go back to Add-Ons > Google Analytics > Run reports. The sheet will render a new tab with the name you entered in the first field.
The resultant tab will look like this:
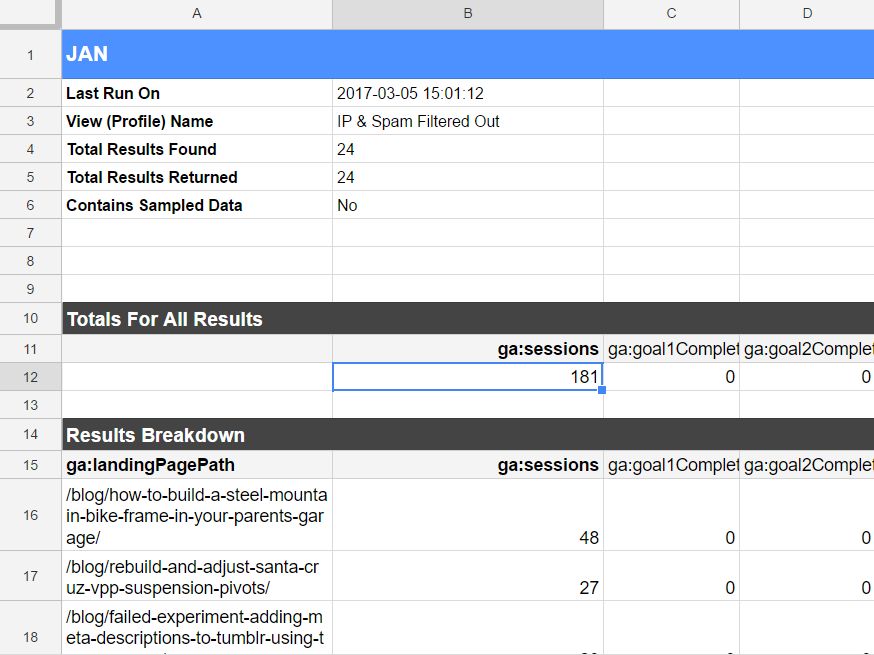
Check cell B6 and make sure it says ‘No’ – this will indicate whether you have sampled data or not. If you do, pick a smaller date range or narrow your area of focus to ensure your data is not sampled.
Step 5: Create Additional Reports
One of the benefits of using this is that you can run multiple reports simultaneously and pull data faster than you ever could using the web interface.
If you want to create another report, simply add data in the columns to the right of your first report. This is a super easy way to pull the same data over multiple months.
Step 6: Analyzing the Data and Building Reports
What’s next is up to you. The API is simply a faster way to get a lot of data out of GA and into a spreadsheet. From there, you can elect to build reports directly in Google Sheets, Google Slides or Google Docs. You can also export the data into Excel or build a PowerPoint.
I tend to prefer building reports in Docs or Slides using data that lives in a Google Sheet. That way it can be easily updated and is accessible to multiple editors who might be compiling the report.
Questions
As always, comment here or tweet at me if you have any questions.
