You’re here because you want to use Google Tag Manager and Google Analytics to track form submissions using the Gravity Forms plugin. This tutorial, like my others for Contact Form 7 and Ninja Forms, will show you how to configure these platforms to track successful submissions, and use different form IDs to setup different goal conversions in GA. These are the steps we’ll be following:
Step 1: Configure Gravity Forms to use AJAX to submit the form.
Step 2: Create a GTM Tag that pushes a Data Layer event when the form is submitted successfully.
Step 3: Create a GTM Trigger that looks for the Data Layer event when the form is submitted, and triggers a second GTM Tag.
Step 4: Create a second GTM Tag that looks for the Data Layer push and creates Google Analytics Events.
Step 5: Create a form ID Data Layer Variable so that we can capture form ID.
Step 6: Set up a Goal Conversion in GA based on the GA Event from Step 3.
Step 1: Enable AJAX Submissions
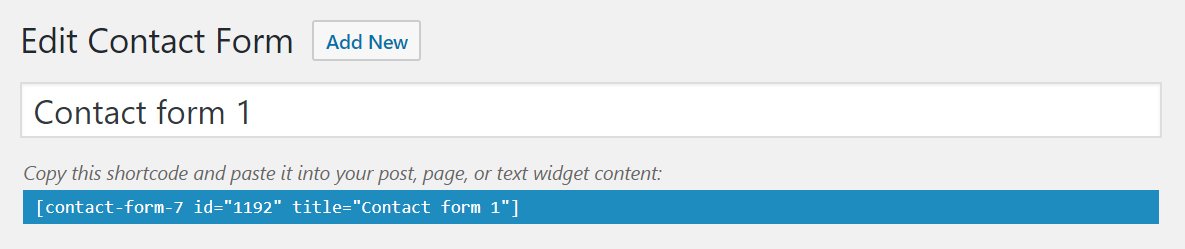
If you use Gravity Forms’ default settings, the page will reload when the form is submitted, and none of these steps will work. Instead you need to enable AJAX submissions, which is done in the form’s shortcode.
Your normal shortcode looks like this: gravityform id=”1″ title=”true” description=”true”
Your edited shortcode will look like this: gravityform id=”1″ title=”true” description=”true” ajax=”true”
Step 2: Create GTM Tag #1
The first tag is a few lines of Javascript that listens for a form submission. Technically it listens for the gform_confirmation_loaded event…which occurs when the confirmation message is loaded…which occurs when the form has been submitted. This is important because it differentiates between actual form submissions and false submissions (like when one of the required form fields is incomplete). The plugin fires a submit event WHENEVER the submit button is clicked (whether actually submitted or not) so the submit event is not reliable (and button clicks aren’t reliable with any plugin).
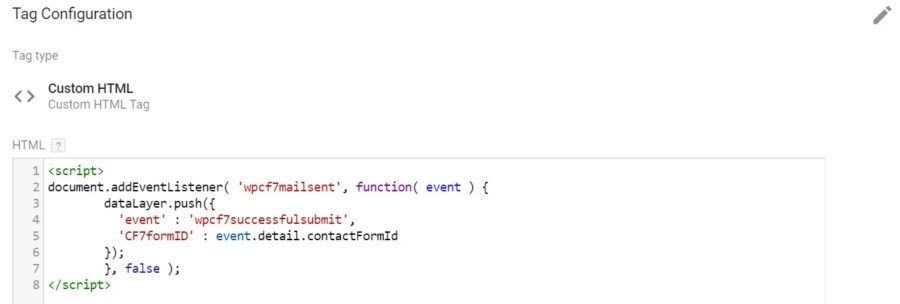
Here’s the tag you need to setup. I named it gravityFormsSubmission.
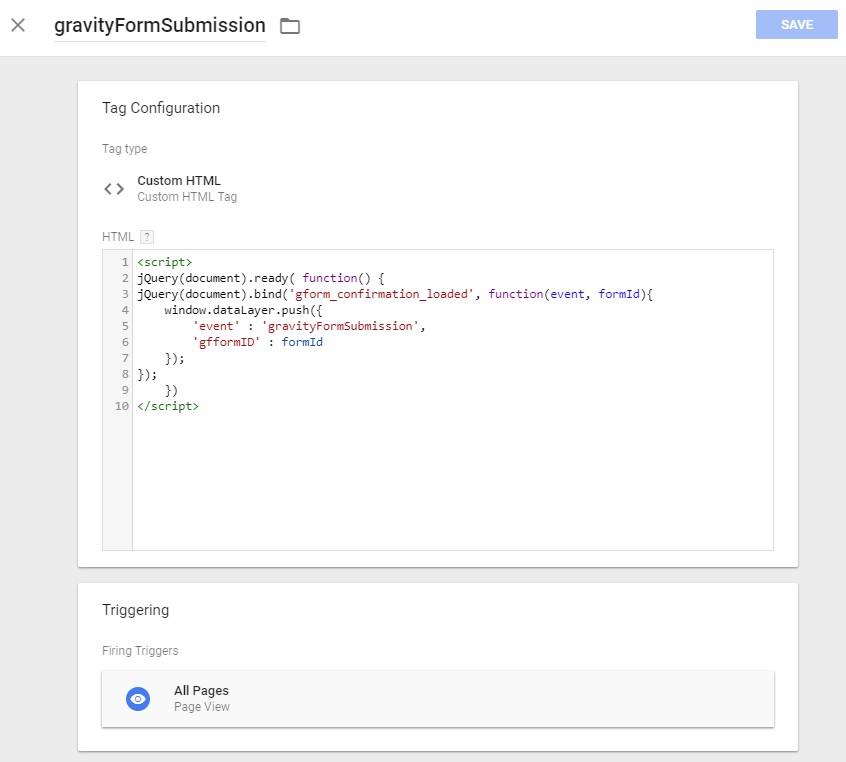
Tag Type: Custom HTML
Add the following code:
<script>
jQuery(document).ready( function() {
jQuery(document).bind('gform_confirmation_loaded', function(event, formId){
	window.dataLayer.push({
            'event' : 'gravityFormSubmission',
            'gfformID' : formId
	});
});
	})
</script>
Triggering: All Pages
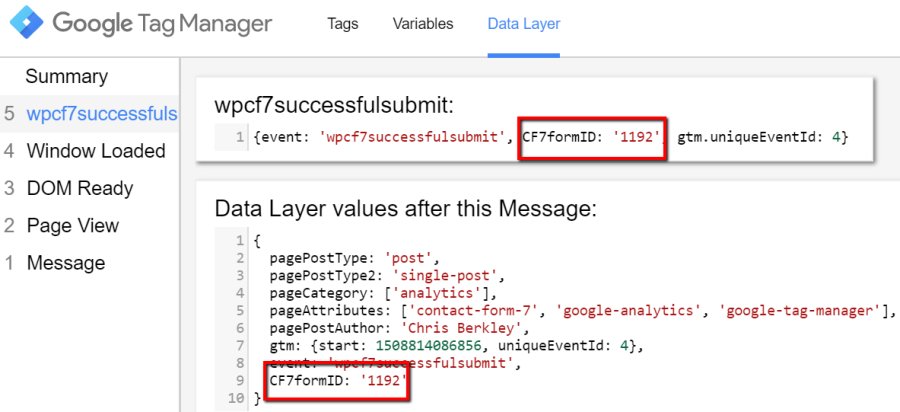
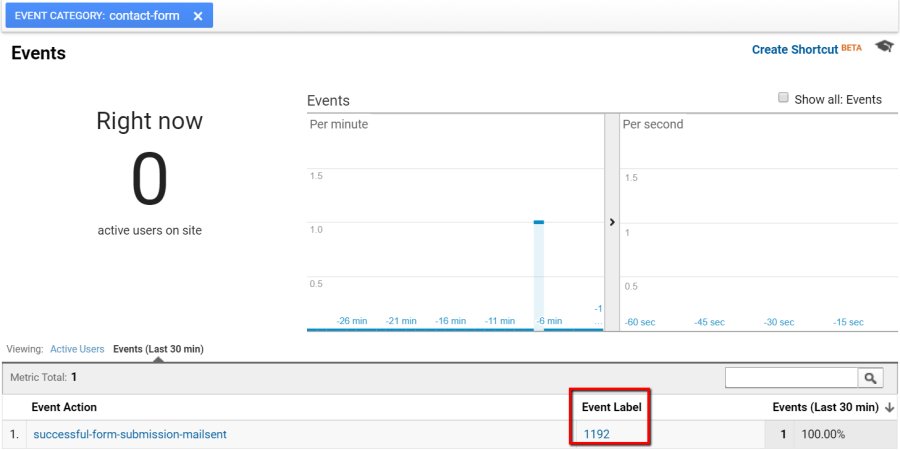
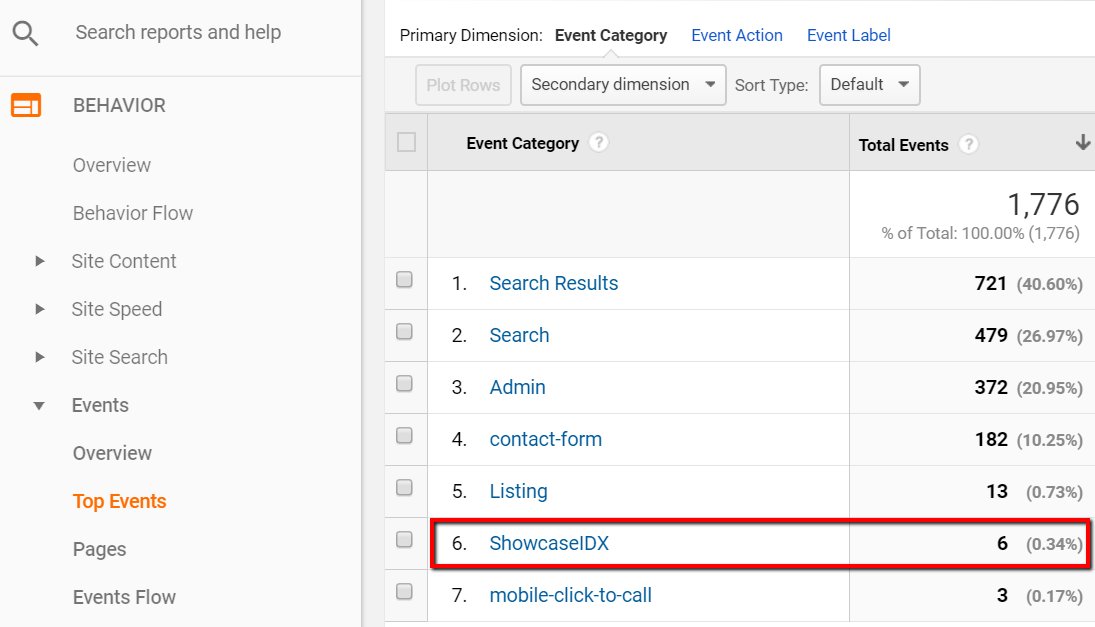
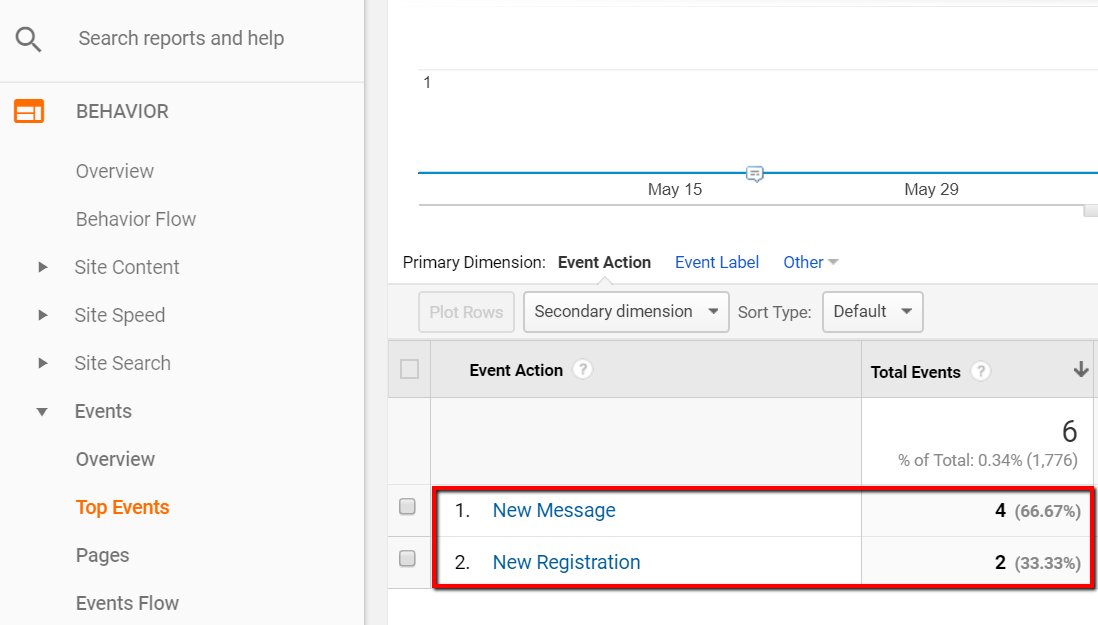
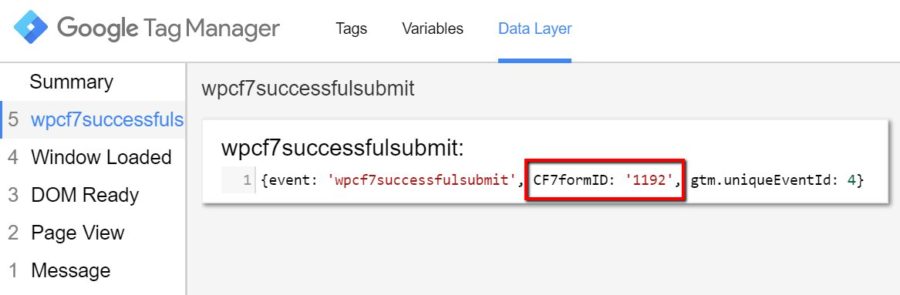
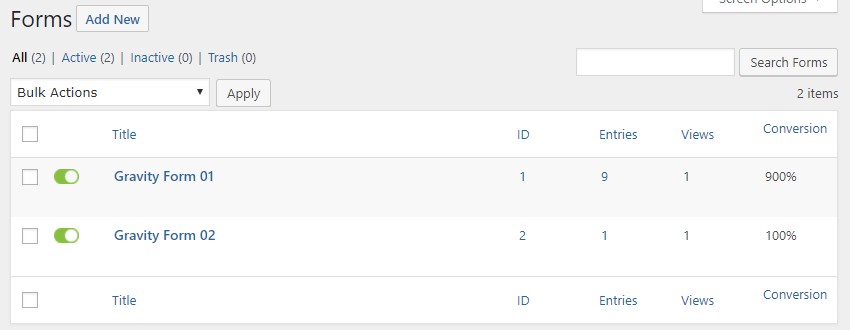
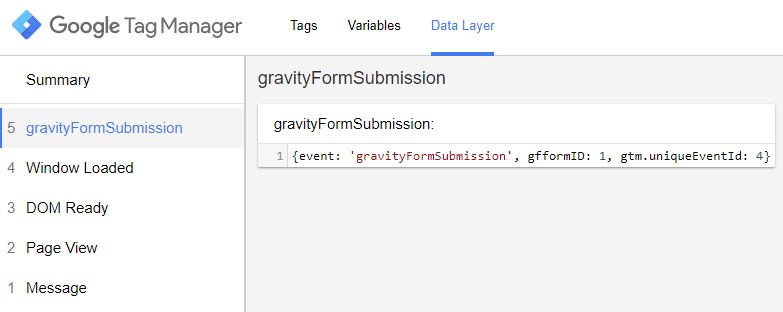
This listens for the gform_confirmation_loaded event and fires an event into the Data Layer called “gravityFormSubmission.” It also grabs the form ID in the Gravity Forms shortcode and pushes it into the Data Layer too, you can see the different form IDs in the screenshot here. You can use different forms with different IDs to create different Goal Conversions later in this tutorial.
Step 3: Create a GTM Trigger
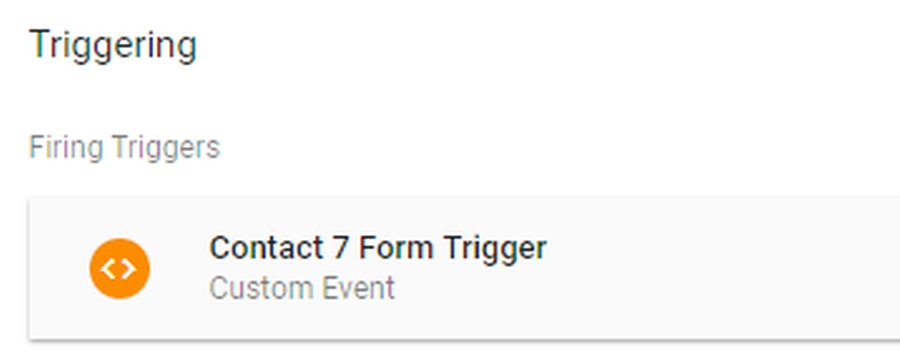
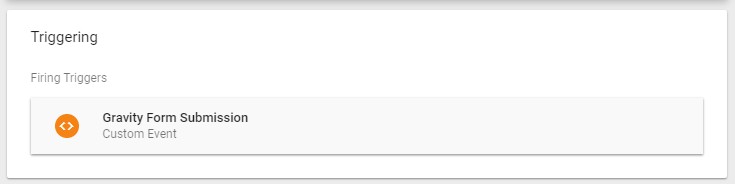
Next, create a Trigger for the Tag you’ve just created. Mine is Gravity Forms Trigger.

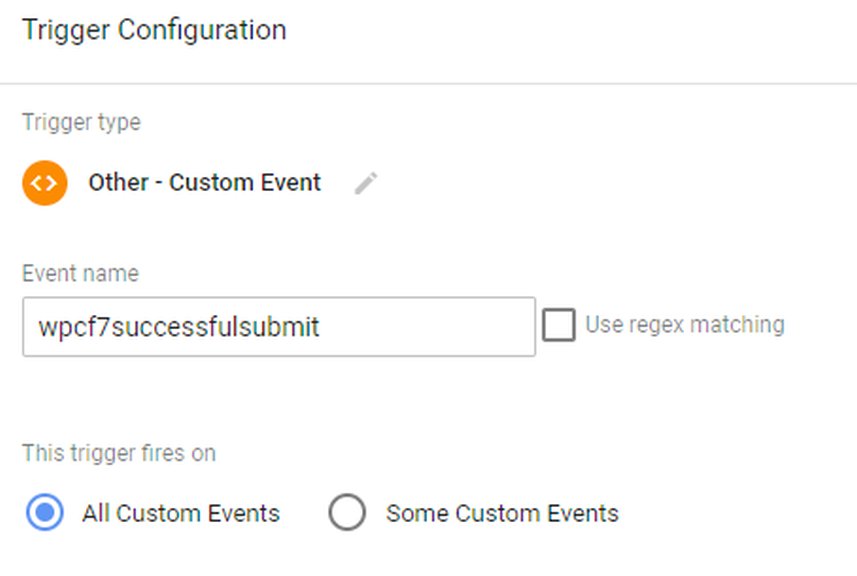
Trigger Type: Pick Other – Custom Event from the default list. We’ll use the event we created in Tag #1 as the trigger event.
Event Name: gravityFormSubmission
This Trigger Fires On: All Custom Events
This uses the custom Data Layer event from Step 1 to trigger a Google Analytics event tag that we will setup in Step 3.
Step 4: Create Tag #2
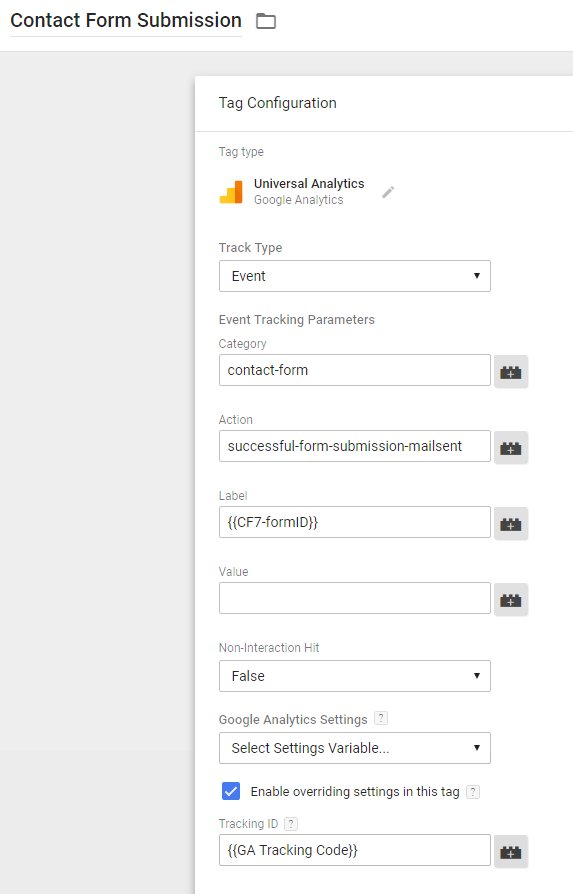
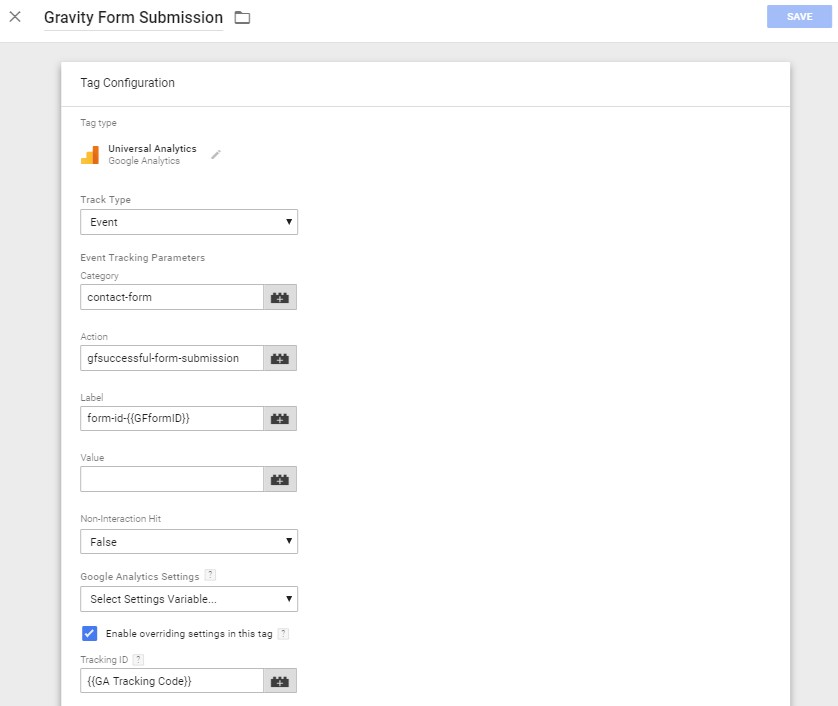
Create another tag and name it Gravity Form Submission. Fill out the following fields as such:
Tag Type: Universal Analytics
Track Type: Event
Category: You can set this as whatever you want and that’s what it’s going to show up as in Google Analytics when you go to the Events report. I named mine contact-form.
Action: I picked gfsuccessful-form-submission.
Label: If you want to track different forms separately, you need to set this as form-id-{{GFformID}} and follow the rest of these instructions closely.
Value: I did not add a value.
Non-Interaction Hit: I recommend selecting False – this will prevent the session from be counted as a bounce if the visitor only looks at one page, but completes a form submission before leaving.
Tracking ID: Your Google Analytics UA-XXXXXXXX tracking ID. I have mine set up as a custom, constant variable, which explains why it says {{GA Tracking Code}}
More Settings & Advanced Settings: If you’re an analytics wiz, there are advanced settings in here that you may want to configure. However, I did not change any of them.
When you’re done, you’ll end up with this:
Step 5: Create a Form ID Data Layer Variable
In Step 2 we pushed the form ID into the Data Layer when the form is submitted. Now we need to capture the form ID and get it into GTM and into our Google Analytics Events.
Add a new User-Defined Variable called GFformID.
Variable Type: Data Layer Variable
Data Layer Variable Name: gfformID (case sensitive).

Submit (publish) your updated GTM workspace and then we’ll move on to Google Analytics Goal configuration!
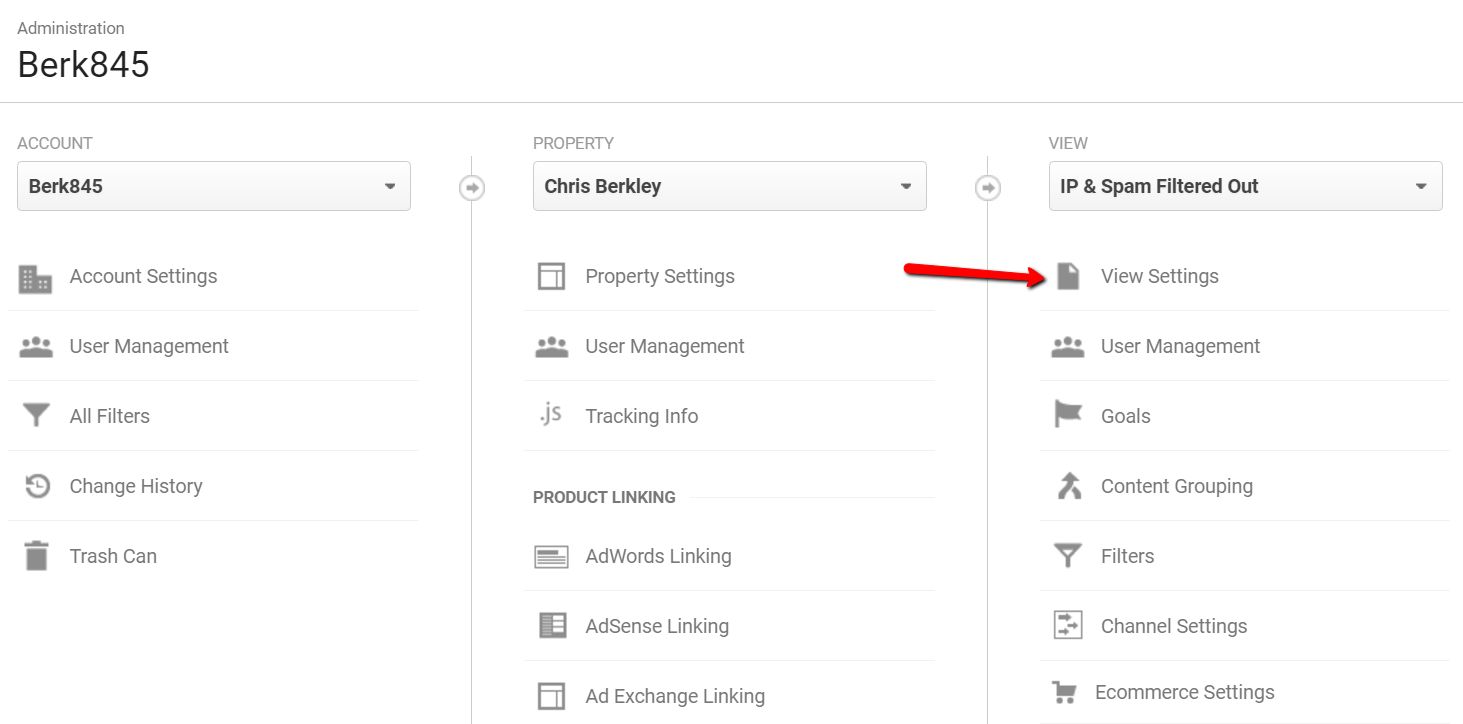
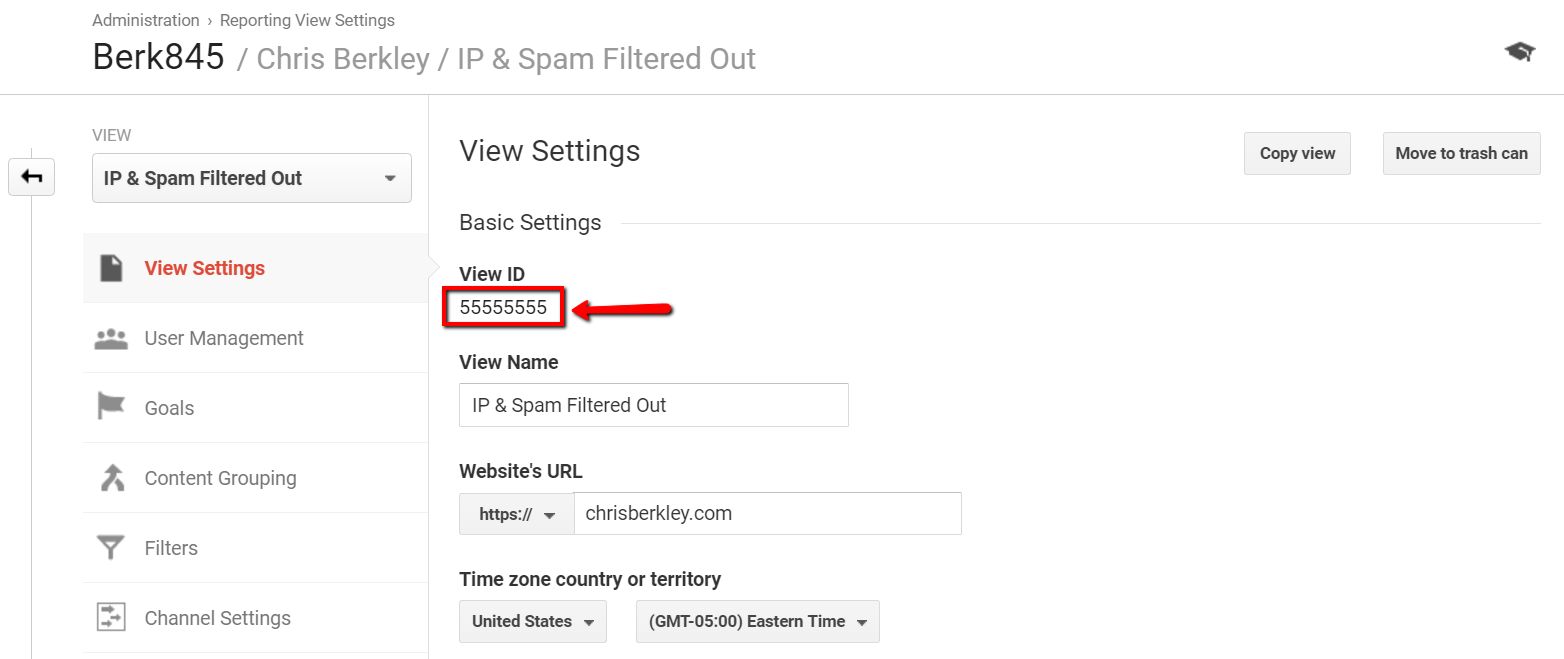
Step 5: Setting up the Goal Conversion(s)
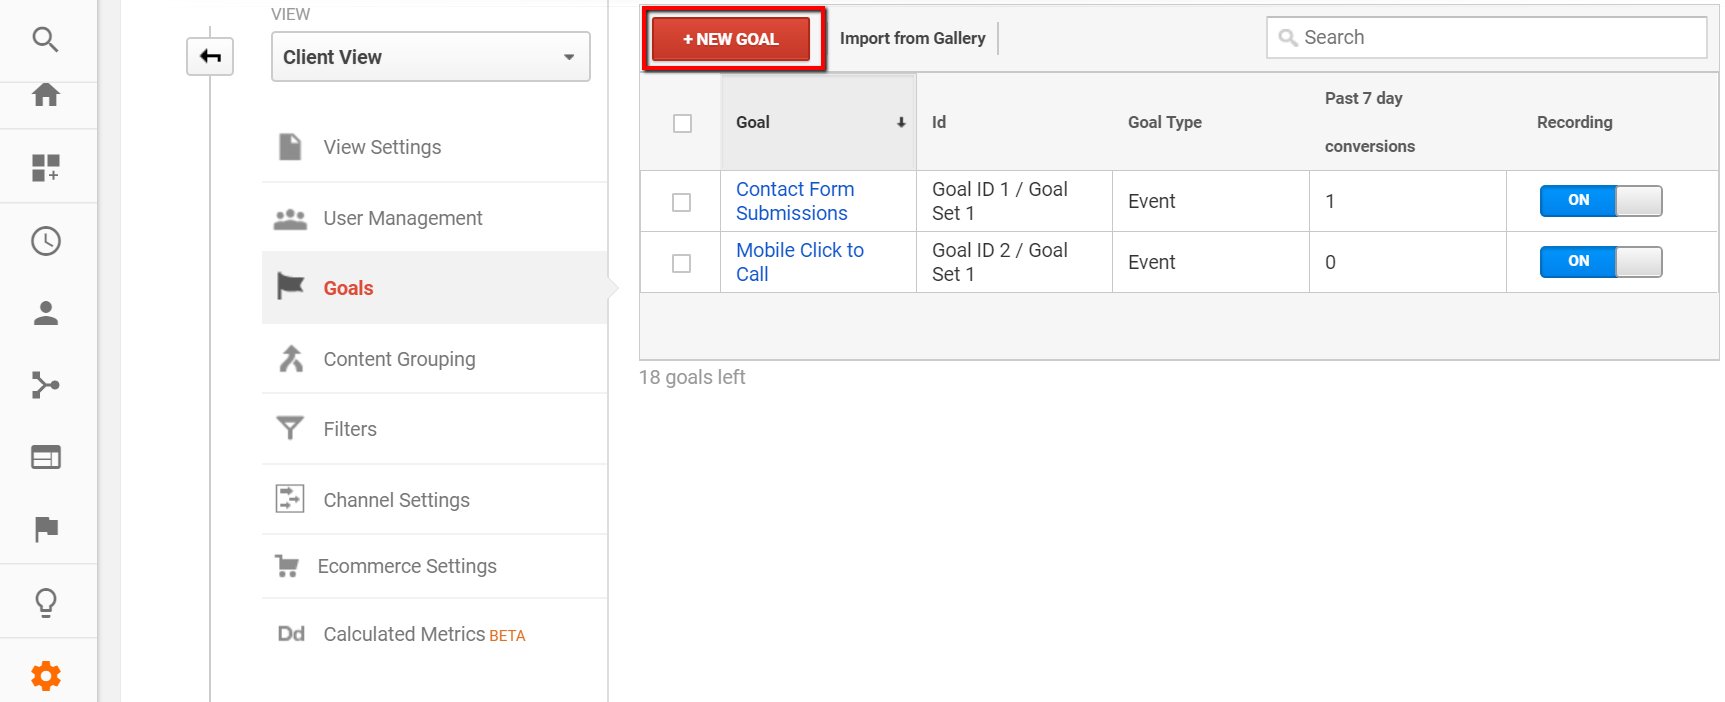
In Google Analytics and navigate to Admin > View > Goals. Click +New Goal and set it up as such:
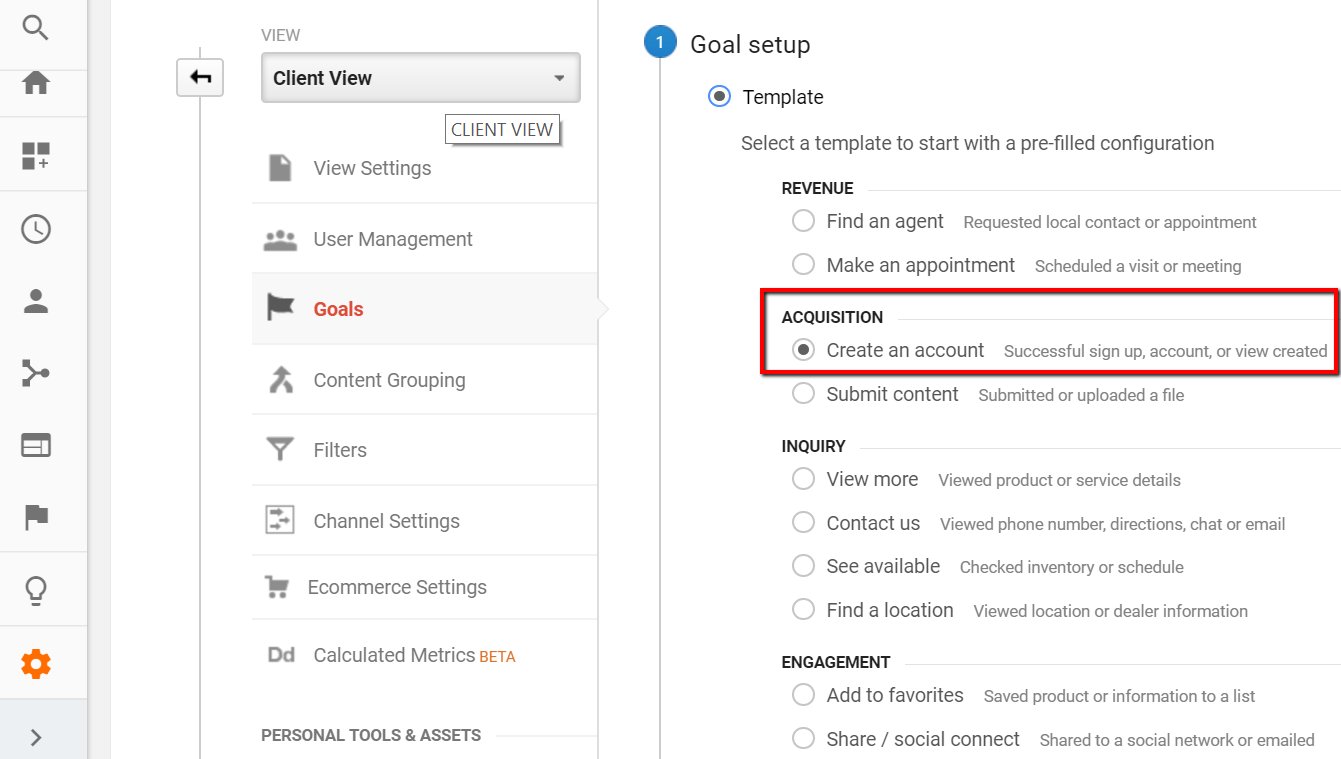
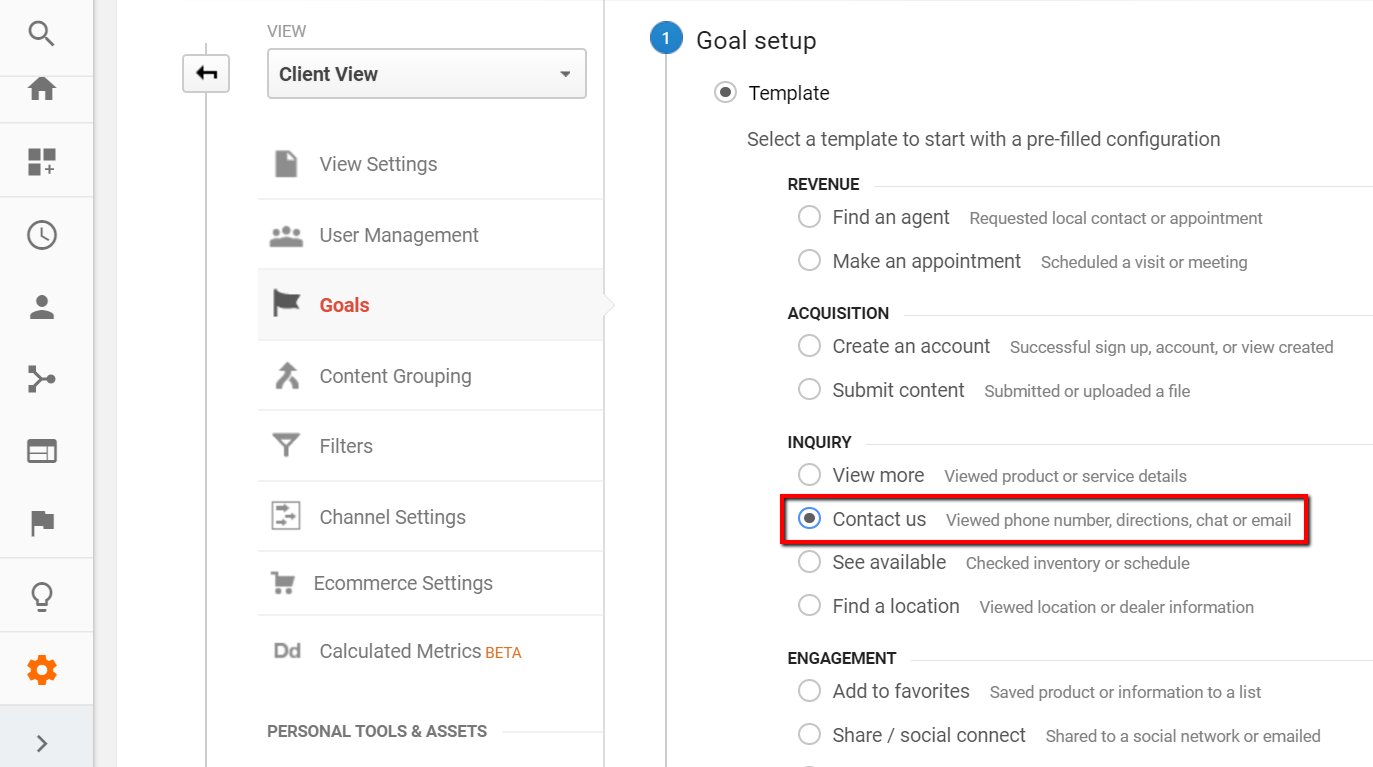
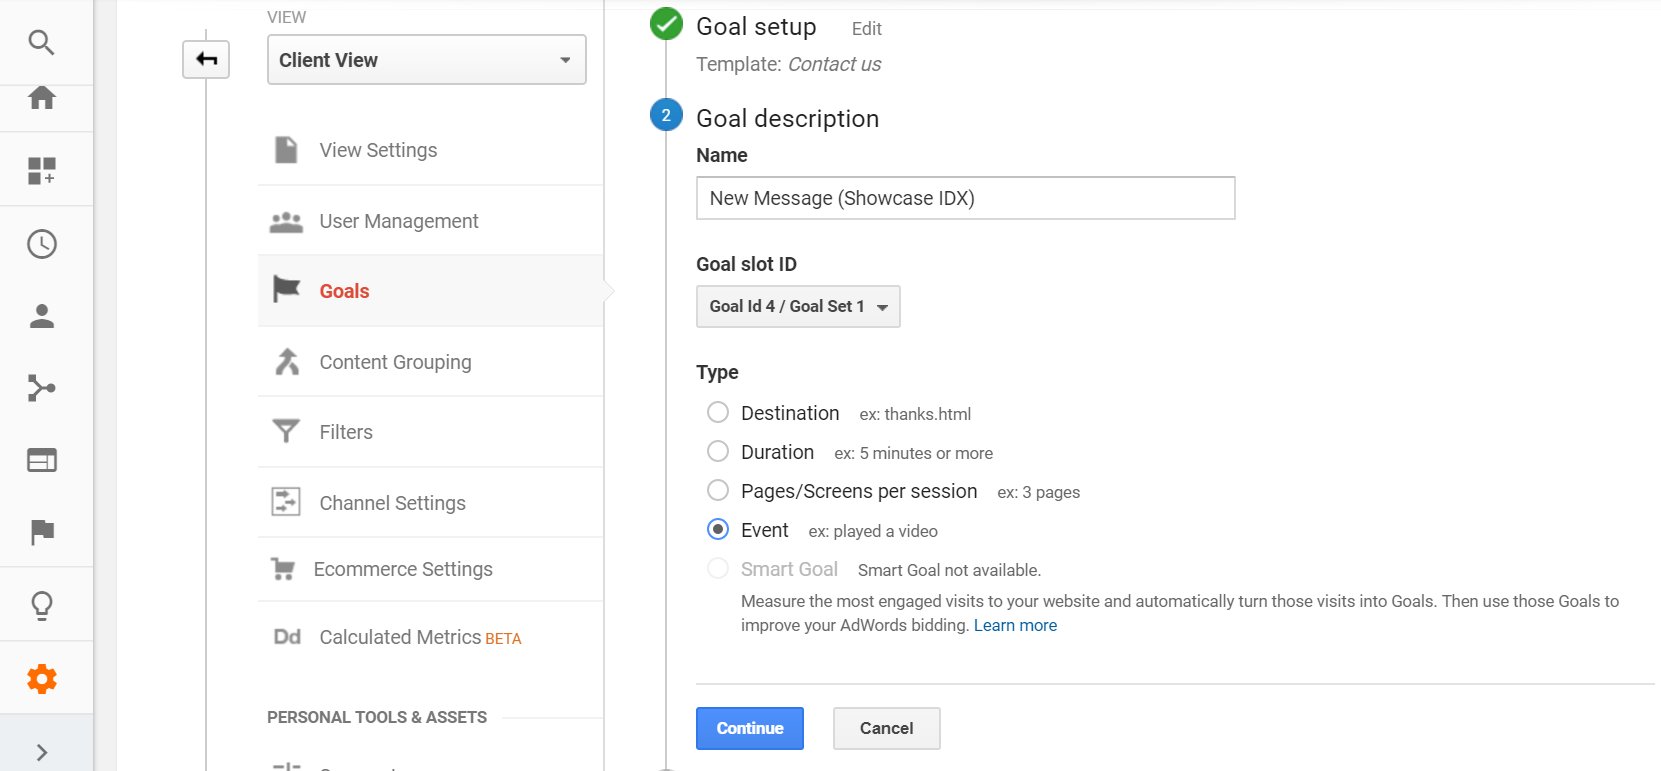
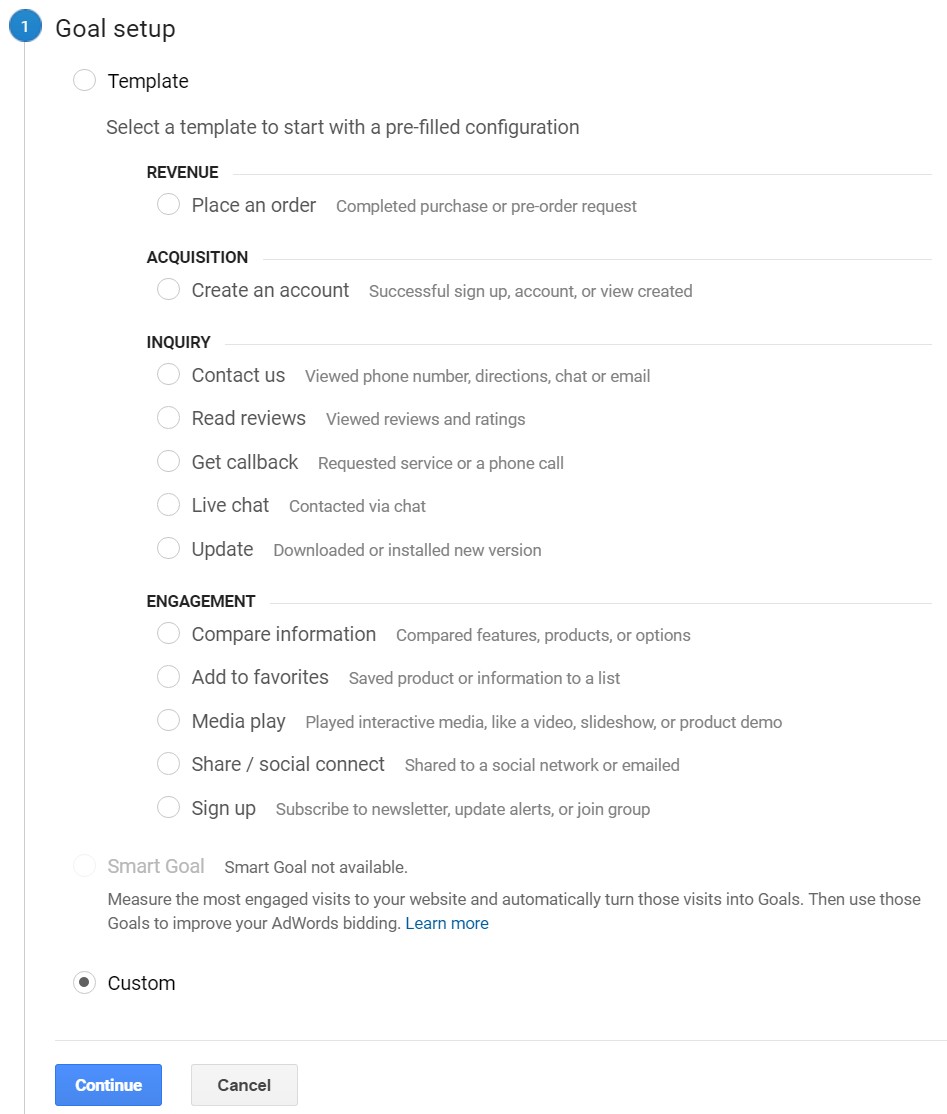
Goal setup: Select Custom
![]()
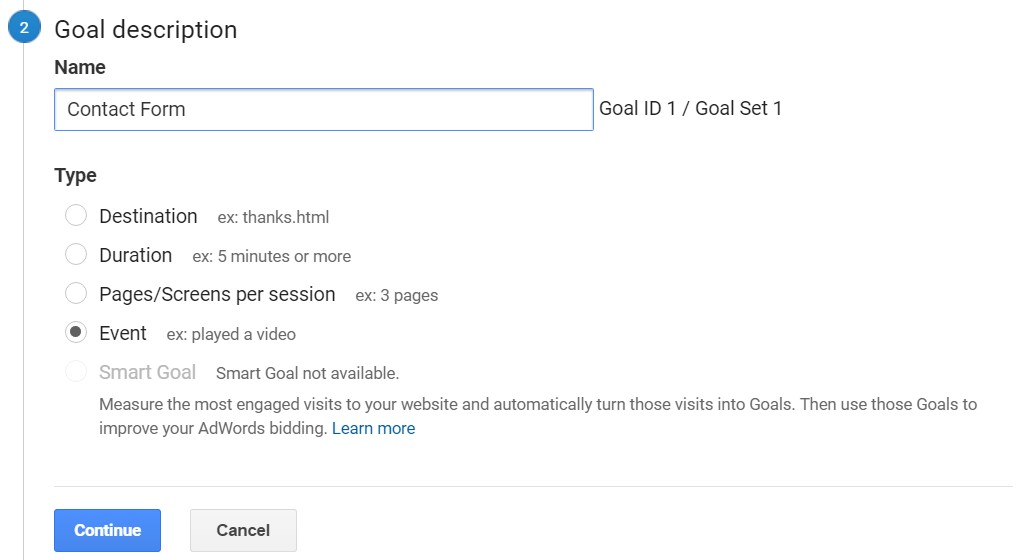
Goal description:
Name: Call it whatever you want. I’ve called mine Gravity Form Submission.
Type: Select Event.
![]()
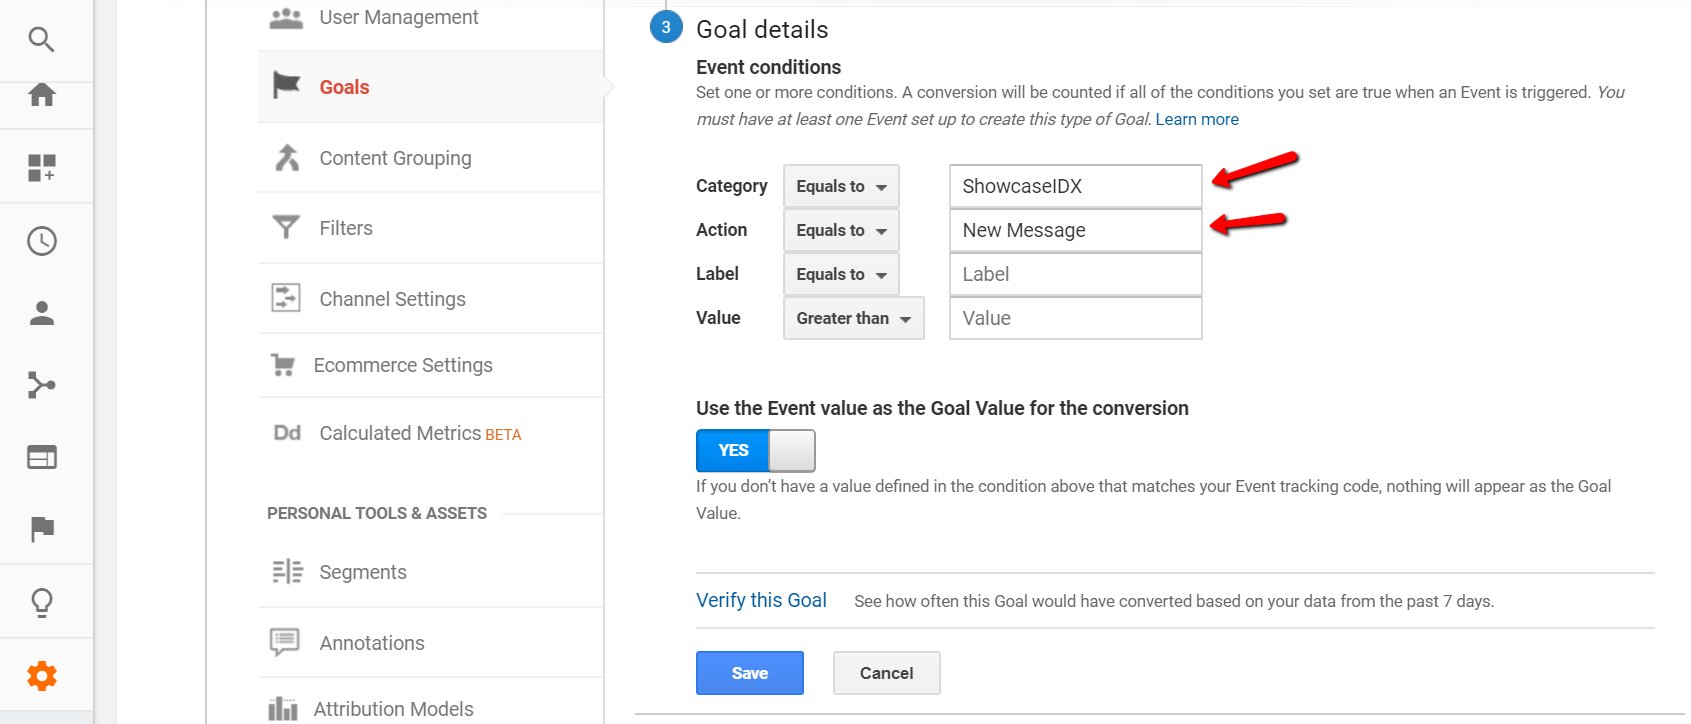
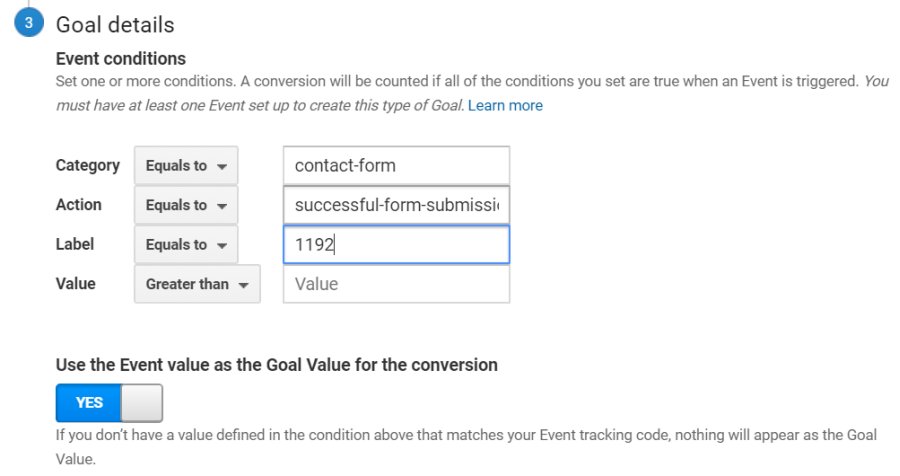
Goal details:
Category: Equals to > contact-form
Action: Equals to > gfsuccessful-form-submission
Label: Select the form ID of the form you want to track. If you don’t want to track different forms separately, you can leave this blank. Mine was form-id-2.
Value: You can add a monetary value here if you’d like.
Use the Event Value as the Goal Value: If you set up a Value in ad a value attached to each event, you could set that up here. Since I did not, I will not.
![]()
Save the Goal Conversion and you’re done. If you want to set up other goals for different form IDs, just repeat the process but change the Label in the Goal Conversion.
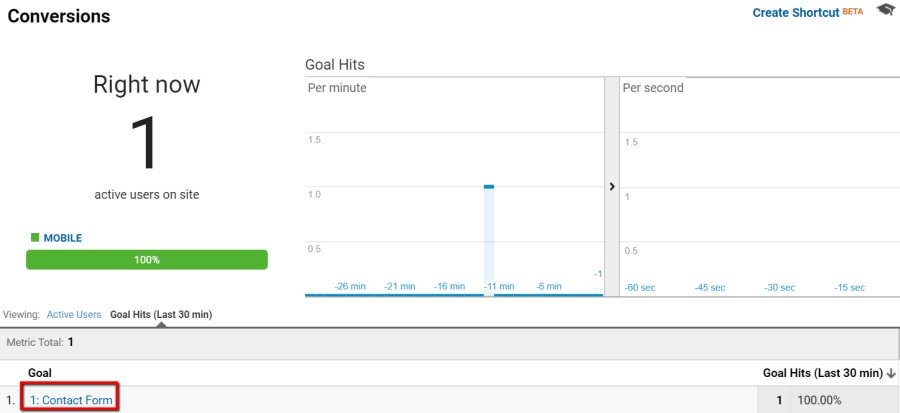
Lastly, test the implementation by doing a couple test submissions on the site. You can use GA’s real time reporting to look for events firing. If you’re not seeing them, make sure you’re not excluding traffic with filters or opt-out extensions in your browser. For a mostly foolproof solution, submit the form on a mobile device using a data connection (no wifi), and use a completely unfiltered GA view to watch for the event.