
How to: Learn the Google Analytics API with G Sheets

By Analytics, SEO No Comments

Listen, I get it. You’re not a developer and neither am I. The letters A-P-I probably give you palpitations. BUT, if you’re using the Google Sheets add-on, the Google Analytics API is really simple. Seriously.

What follows here is a beginner’s introduction that shows how to start using the API. This is for non-technical types and will start at square one. Full documentation is available at Google’s Implementation Guide.

Step 1: Getting Google Sheets Set Up

First, log into a Google account that has access to the Google Analytics account you normally use. Go to Drive and open a new Google Sheet, then go to the menu bar and select Add-ons > Get add-ons.

Next, search for Google Analytics and you’ll find this add-on:

Go ahead and click the +Free button to add it to your Google Sheet. When the authorization prompt pops up, click Allow at the bottom right.

Step 2: Getting Your Report Configuration Set Up

When you create a report the first time, the add-on does offer a user-friendly interface with drop down menus, etc, to help you set up your first report. You can access this by going to Add-Ons > Google AnalyticsCreate new report. I’m not going to use that, because ultimately, you’ll be making changes in the Sheet itself and it’s more valuable to understand what each of these fields does.

Now that you’ve got the add-on installed, go to Add-Ons > Google Analytics > Run reports. You’ll see this pop-up indicating the report failed, which is expected – we haven’t configured anything yet.

The point of doing this is: the add-on has now populated all the configuration fields that we’ll be working with to get it set up properly.

All those fields probably look confusing, but we’ll start breaking them down one by one and you’ll see it’s not that complex to pull basic data.

Step 3: Configuring Individual Fields

Report Name

When you run the report, the add-on is going to create a new tab in your Google Sheet with the information you’ve selected. Report Name simply tells the add-on what to name that tab. You can call it whatever you want, I’m calling it JAN.

Important Note: When you re-run the report multiple times, it will replace the data in the tab you’ve created. If you change the Report Name, it will create a new tab, preserving the old one. If you run the report and then delete the Report Name, it will keep the existing tab and preserve the data without creating another tab.

Type

Enter core.

core

View (Profile) ID / ids

Go into the Google Analytics view you want to pull data from. Click over to Admin and select View Settings under View.

Copy the View ID number.

Paste this into the Google Sheet with ga: in front of it.

ga:55555555

Start Date

This is no different than setting the data range in Google Analytics. Add the start date in a normal date format.

1/1/17

End Date

Same as the start date, just pick your end date. Make sure it’s a date in the past, and a day with complete data. For example, if it’s March 5th, don’t pick a date range of 3/1/17 – 3/31/17. Also, don’t pick a date range of 3/1/17 – 3/5/17 because that day isn’t over yet and you’ll have incomplete, sampled data (Learn more about data sampling).

Last N Days

You can also pick a fixed number of days prior to the current day. I don’t use this field, but if you did, you’d simply enter an integer for the number of days you wanted to report on. For clarity, I suggest removing the start/end date, but the add-on does appear to override those dates if the Last N Days field is populated.

Metrics

This is the important stuff you really want to measure and you can have multiple metrics in here. You can use the Dimensions & Metrics Explorer to find Metrics to use. Since this is a basic guide, we’ll stick to simple ones.

  • ga:sessions – Pulls the number of sessions.
  • ga:goal1Completions – Pulls the number of Goal 1 Completions.
  • ga:goal2Completions – Pulls the number of Goal 2 Completions.

These will all get entered into the same cell.

ga:sessions
ga:goal1Completions
ga:goal2Completions

Dimensions

Using the GA interface, you have the option to define the primary dimension, and you can do that here too. Popular choices might be:

  • ga:landingPagePath – Find landing pages responsible for sessions and goal completions.
  • ga:medium – Find the number of sessions and goal completions by channel (Organic vs. Referral vs. Paid, etc.)
  • ga:sourceMedium – Find sessions and goal completions by source & medium (Google Organic vs. Bing Organic vs. Google CPC, etc.)

We’ll keep it simple and go with landing pages. If you want to measure those by a specific medium, we’ll add that in a few paragraphs below this.

ga:landingPagePath

Sort

Really simple. How do you want the data sorted? Obviously, you can only sort by one dimension, so pick the dimension of your choice from above and enter it in this cell. GA’s default is to sort by sessions from high to low, and if you want to do that, enter a minus sign before the metric.

-ga:sessions

Filters

You can start to get really complex here, and if you use filters when you normally look at data in GA, you’ll need to add those here. For now, we’ll use a basic filter to look at organic traffic only.

ga:medium==organic

This ensures we’re only pulling sessions, goal completions and landing pages from the organic medium.

Segment

Segments are arguably the most complex field of this report. There are multiple ways you can create segments, and the criteria for building them can be found in Google’s core reporting documentation.

In short, they can follow a syntax similar to this, where you’d have a segment for sessions from Canada:

sessions::condition::ga:country==Canada

For simplicity, I won’t use a segment in this walk-through.

Sampling Level

I never pull sampled data because it doesn’t paint the whole picture. Because of that, I opt for the higher precision setting and I suggest you do too.

HIGHER_PRECISION

Start Index

This option allows you to only show results from a specific starting point. For example, if you were pulling landing pages and wanted to ignore the top traffic-driving page (like the homepage) you can set this to ‘2’ and it will ignore that top result. I don’t use this much.

Max Results

The maximum value is 10,000, so no real reason to set it lower than that.

Spreadsheet URL

If you want to export the results into a separate sheet, you can enter the URL here.

Final Review

Once you’ve filled out all the fields, your configuration will look something like this:

Step 4: Run the Report

Once you’ve filled out all the fields, go back to Add-Ons > Google Analytics > Run reports. The sheet will render a new tab with the name you entered in the first field.

The resultant tab will look like this:

Check cell B6 and make sure it says ‘No’ – this will indicate whether you have sampled data or not. If you do, pick a smaller date range or narrow your area of focus to ensure your data is not sampled.

Step 5: Create Additional Reports

One of the benefits of using this is that you can run multiple reports simultaneously and pull data faster than you ever could using the web interface.

If you want to create another report, simply add data in the columns to the right of your first report. This is a super easy way to pull the same data over multiple months.

Step 6: Analyzing the Data and Building Reports

What’s next is up to you. The API is simply a faster way to get a lot of data out of GA and into a spreadsheet. From there, you can elect to build reports directly in Google Sheets, Google Slides or Google Docs. You can also export the data into Excel or build a PowerPoint.

I tend to prefer building reports in Docs or Slides using data that lives in a Google Sheet. That way it can be easily updated and is accessible to multiple editors who might be compiling the report.

Questions

As always, comment here or tweet at me if you have any questions.

Course & ItemList Education Schema

By SEO, Technical SEO 5 Comments

In December, Google announced they’re supporting Course Schema by providing rich snippets in search results. Where can this Schema be applied? Educational content that is “A series or unit of curriculum that contains lectures, lessons, or modules in a particular subject and/or topic.”

The Education Schema doesn’t appear to have any tangible benefit for desktop results, but here’s a screenshot of what it looks like on mobile:

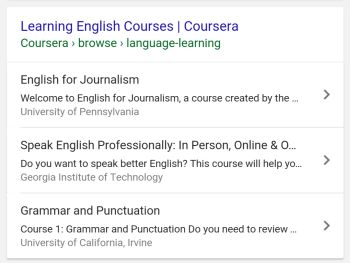
What it means: Educational sites can increase their presence in mobile organic results by four fold. Not only does the ranking page appear, but there are up to three additional links featured underneath. This is an incredible land grab, one that nearly dominates the entire screen on a mobile device.

There must be some criteria to determine what sites qualify for this Schema, but it’s not exactly clear. If it worked on any site, folks would already be abusing this. It doesn’t appear to be keyword-specific, and more likely relies on Google’s interpretation of what constitutes an education-related site.

How Does Educational Course Schema Work?

There are two parts: ItemList Schema and the Course Schema itself. The ItemList Schema works in tandem with the Course Schema to present the rich snippet seen above.

ItemList Schema

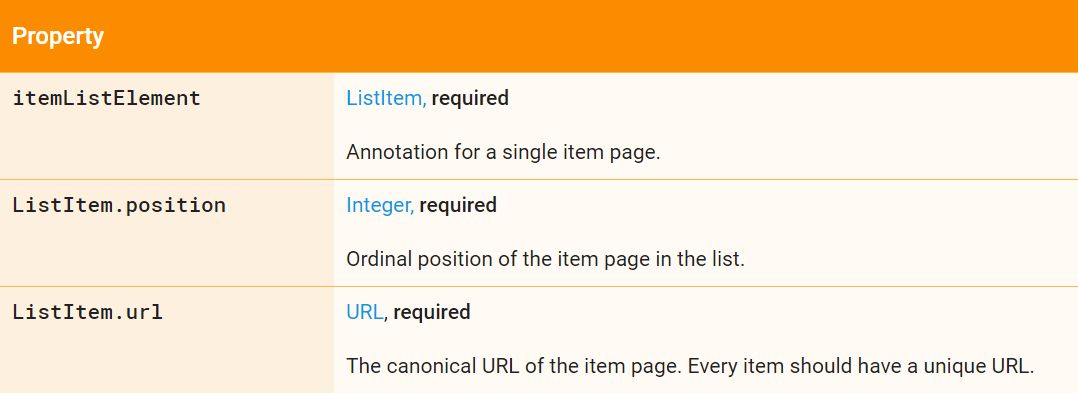
ItemList Schema is placed on a program or category page that features individual classes, courses or degrees. It’s literally just Schema that indicates a list of links present on the page. There are three fields:

  1. itemListElement
  2. ListItem.position
  3. ListItem.url

Here’s what the code looks like:

<script type="application/ld+json" >{
	"@context":"http://schema.org",
	"@type":"ItemList",
		"itemListElement":[
		{"@type":"ListItem",
			"position":1,
			"url":"URL-1"},
		{"@type":"ListItem",
			"position":2,
			"url":"URL-2"},
		{"@type":"ListItem",
			"position":3,
			"url":"URL-3"}]
	}
</script>

Course Schema

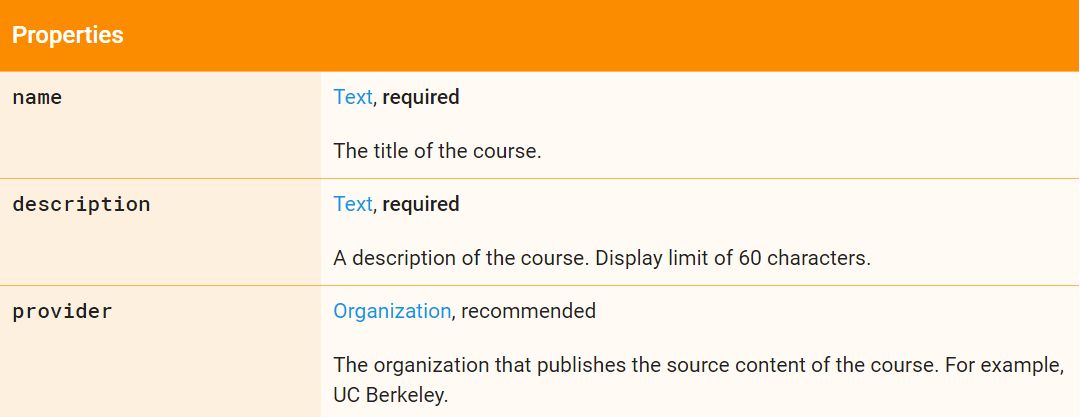
The actual Course Schema isn’t complex either. Course Schema is placed on each of the individual pages featured on the program or category page.

It has three fields:

  1. Name
  2. Description (limited to 60 characters)
  3. Provider

Here’s what the code looks like:

<script type="application/ld+json">
{
  "@context": "http://schema.org",
  "@type": "Course",
  "name": "COURSE NAME",
  "description": "COURSE DESCRIPTION",
  "provider": {
	"@type": "Organization",
	"name": "NAME",
	"sameAs": "URL"
  }
}
</script>

Notably, Course Schema itself is pretty bland and not specific to education at all. However, this Schema is currently listed as pending on Schema.org, and there are a large number of additional fields (none of which appear to provide tangible benefit other than helping Google crawl the page).

What’s The Benefit of Course Schema?

First, taking up extra space in search results knocks competitors lower. Secondly, it provides sites with the ability to rank other pages for specific keywords where they normally wouldn’t rank.

For example, if you have a category page that ranks for Healthcare Degrees, you can now add a link to specific degree programs like Master of Public Health or Master of Health Informatics. These are pages that are likely lower in the conversion funnel and would never normally rank for a higher funnel keyword.

Effort vs. Impact

There’s very little effort involved here. Writing the Schema itself takes less than 30 minutes and if you have the ability to insert a block of JSON code on the four pages in question, implementing shouldn’t take any longer either.

Any real investment in time should go towards strategizing what pages to include in the Schema. Pages that are higher priority or higher traffic are likely to be better candidates.

The impact is clear and almost immediate – I recommend submitting these pages to Search Console for crawling and indexing once the Schema is live. This is a rare scenario where SEO provides instant gratification.

Reporting & Measurement

Once the Schema is live, you can use a combination of traffic in Google Analytics and impression/click data from Google Search Console to gauge the full impact. Search Console will also give you the keyword data, so that’s likely to be more valuable for tracking clicks from keywords where the page would not normally rank.

If you have any questions, comment here or tweet at me: @BerkleyBikes.

A Simple Guide to SEMrush for SEO

By Digital Marketing, SEO No Comments

I originally wrote this post for the Seer Interactive blog.


SEMrush is powerful, versatile and all things considered, remarkably accurate. With that being said, SEMrush’s advanced features can be both a gift and a curse. With advanced functionality often comes complexity and it’s fairly easy to get lost in SEMrush’s broad array of features.

This guide will serve as a walk through of SEMrush’s most useful ones. I’ve broken the guide into five parts: organic rankings, keyword research, mobile user experience, competitor insights, and backlink data. Under these five topics, I’ve included how-tos on features in SEMrush to use in relation topic for your SEO endeavors.

Read More

Forget the Primaries, Which Candidate is Winning SEO?

By SEO 3 Comments

presidential-election-candidate-website-seo-analysis

On the precipice of primary season, there’s maybe never been a more competitive election. On the Democratic side, you’ve got Bernie Sanders and Hillary Clinton, neck and neck after the Iowa Caucus. On the Republican side, a half dozen candidates who seem to swap places in the polls on a near weekly basis, and until recently another half dozen waiting in the wings.

If Barack Obama’s 2008 and 2012 campaigns have taught us anything, it’s that smart use of digital media can pay off big time in the election cycle. Obama rallied voters, especially younger ones, through smart use of social media. In the 2016 election, every candidate is on Facebook, Twitter, even Instagram.

But what about SEO? Every candidate has a website – what exactly are they doing with them? How are people getting there? With more than 14 major candidates in contention, someone has to rank for something, right? Is anyone actively targeting an SEO strategy?

Read More

Brazing water bottle bosses

Welding and Completion: The Beast Lives

By Uncategorized No Comments

Over a year ago I built a custom mountain bike frame from metal tubes to design to completion, but never finished writing about it. This is part three, when we finally welded it together. 

Part 1: Welding the Front Triangle, and Rear Assemblies

Labor Day weekend Paul and I drove to Binghamton for the first of two welding sessions. The colossal amount of work, combined with my jig design necessitated two visits, the first of which would finish the front triangle and weld the chainstays and seatstays as separate assemblies.

Before any welding occurred, Paul brazed on the four water bottle bosses as well as my custom cut dropper post outlet. Brazing essentially entails coating the area in flux, heating the tube up until it’s obscenely hot and then touching silver to the joint and letting it flow. It’s impressive to watch.

Paul Dotsenko preparing the torch for brazing

Read More

Pinterest Visual Search Implications for Marketers & How it Works

By Digital Marketing, SEO, Social Media No Comments

I originally wrote this post for the Seer Interactive blog.

living-room-pinterest-visual-search-results-zoomed

It happens all the time – you’re on Pinterest and see something so cool that you immediately want to find out what it is, and where you can purchase it. Basically, an experience right out of a marketer’s dream.

If the Pinterest image you’ve landed on is the focus item in the Pin, then it’s quite easy to find a place to buy it, either right on Pinterest or elsewhere online. But what if you’re interested in a specific item in only a small part of a photo? Or what if you want to see other photos of the item that aren’t exact matches, but are similar?

This is where Pinterest’s new visual search shines. It gives you the ability to search Pinterest for pins that visually resemble the one you’re looking at, or search for a specific item within the photo.

With Pinterest being a must-have platform for marketers, it’s important to understand how this feature works and what marketers stand to gain from it. In the sections that follow, we’ll illustrate this feature’s capabilities and suggest marketing strategies to begin thinking about in regards to this new Pinterest feature.

Read More